Nagoya City Science Museum
TOP > Global Warming > If the growth rate of carbon dioxide increases, the world temperature...

If the growth rate of carbon dioxide increases, the world temperature...
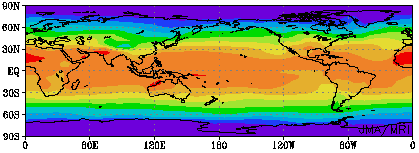
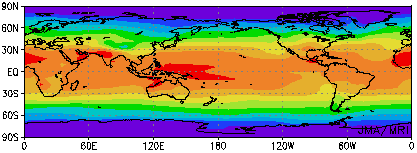
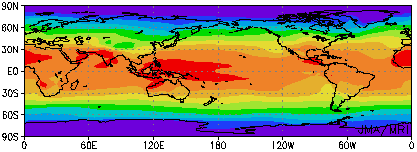
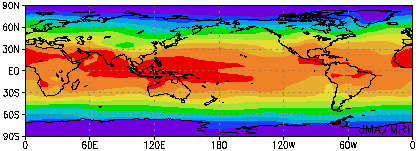
These diagrams show the world air temperature distribution (yearly averages) derived using air temperature changes calculated by computer assuming carbon dioxide discharge levels continue to rise at a yearly rate of 1%.
In 31-40years:
In 51-60years:
Temperature rises can be seen in the equatorial zones of West Africa, the Middle East, India, the western part of the Pacific Ocean, etc.
In 71-80years:
Regions where temperatures have risen above 30 degrees C are expanding, including the equatorial zones of West Africa, the Middle East, India, the western part of the Pacific Ocean, etc.
In 91-100years:
Regions mentioned above where temperatures had risen above 30 degrees C have expanded further, and temperature rises can even be seen in the central part of china.
As shown, with carbon dioxide discharge levels continuing to gradually creep up as they have been until now, temperatures will increase throughout the world.