Nagoya City Science Museum
TOP > Exhibition Guide > Keyword Search > Starting with "N" > Nagoya > Manufacturing City Panorama

Manufacturing City Panorama
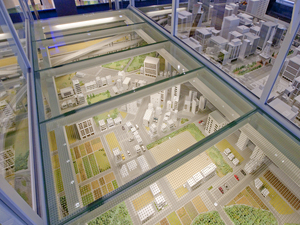


Purpose of Exhibition
This panorama refers to a fictional version of the city of Nagoya. This city is a manufacturing city, and it is known for its thriving manufacturing industry.
This is mainly intended to demonstrate the flow of things, people, and energy.
Additional Knowledge
[Number one for Shipment of Manufactured Goods]
Since 1977, Aichi Prefecture has been the country's number one for shipment of manufactured goods. We can call ourselves the number one thriving manufacturing area in Japan.
When looking at industry shipment of major industrial prefectures (shipment value of manufactured goods) and looking at the movements until the 1970s, Tokyo, Osaka, Kanagawa and Aichi were about the same size, all in the top group. Since the 1980s, it has dramatically changed.
The greater Tokyo and Osaka area (Tokyo, Saitama, Osaka and Hyogo), have been following the trend to reduce industries. Aichi and Shizuoka prefectures maintained a relatively large proportion of the automotive industry. Those have maintained a strong standing in comparison. This shows that Aichi is supported by car manufacturing.
The automotive industry has played a driving force in Japan since the 1980s.
As a result, other industrial prefectures remain at a level of 15 to 20 trillion yen, but Aichi prefecture with 47. 5 trillion yen (2007) wins first place by far.
[Flow of People]
Manufacturing produces employment not only involved in manufacturing, but transportation of goods and also service industries related to manufacturing.
We pay attention to the action that prompts development of other industries. Employment creates a flow of people, and a base for stations and airports.
The average daily number of passengers of JR Nagoya Station, Meitetsu Nagoya Station and Nagoya Subway Station are 1.15 million, 260,000 and 170,000 respectively (data for 2007 to 2009), which are big numbers . The number of passengers of JR Nagoya Station does not surpass the number one, Shinjuku Station with 3.6 million, but is number six in the country with an extremely large number.
The Central Japan International Airport also produces a great flow of people. In 2006, there were 6.74 million domestic passengers and 5.47 million international passengers. Although these numbers include regular tourists, it seems that there was also a lot of business related travel.
[Distribution of Goods]
Extension of manufacturing creates flow of goods and logistics. The flow of production from offshore production sites has become obvious, but with high-quality manufacturing within the country, raw materials, semi-finished products and finished goods enter and exit through ports and airports.
In 2008, Nagoya customs held the country's largest export record with 19.3 trillion yen, ahead of Tokyo and Yokohama.
The foreign trade volume of cargo handled by the port of Nagoya (cargo handled foreign trade) is 121.96 million tons annually, therefore it is among Japan's five major ports. In value equivalence, it reaches about 12 trillion yen in one year for Nagoya port. This amount is about 10 percent of Japan's total trade volume. With particular attention devoted to its surplus trade, the port of Nagoya handles about 5.1 trillion yen, about an impressive 59% of Japan's total surplus trade.
Thanks to manufacturing, the central area is very active. The shipments of manufactured goods to foreign countries also stand out in national ratios. Most of those are shipped to foreign countries using Nagoya port. Therefore, Nagoya port plays a very important role as the export port of the industries of the central Japan region.
[Energy]
Energy is necessary for manufacturing. Energy saving is consistent in factories and natural energy such as solar light utilization continues. Minimizing CO2 emissions is possible in every factory.
Here is some interesting data. Energy use in the central Japan region in 16 years from 1990 to 2006 has expanded 11.5%. This is an extremely low expansion compared to the economic development. For this period, the industrial world had reduced by 6.7% its energy consumption. On the other hand, private sector energy consumption increased by 50%. This data shows that the industries already saved energy.
CooperationNagoya Railroad Co., Ltd.
Article by Koichi Mabuchi, curaotr