FUJI NAGOYA SCIENCE MUSEUM
TOP > Exhibition Guide > Floor Map> Weather and Our Lives

Weather and Our Lives
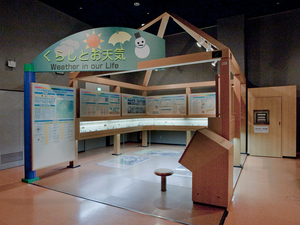

Purpose of Exhibition
A lot of everyday life-related weather topics!Besides, with an array of 365 test tubes, the last 12 months of rainfall is shown.
Additional Knowledge
[Rainfall]
Rainfall is measured in millimeters. What measured after a rainfall is the depth of the rain water unless it runs off. For instance, a rainfall of one millimeter per hour sounds negligible. Now, suppose that Shirakawa Park had a rainfall of one millimeter, let's figure out the volume of the rain water in the park;
area of Shirakawa Park x Depth of Water = Volume of Water82,263m2 x 1mm(0.001m)=82,263 m3, where 1 m3 of water means 1 ton. The water, therefore, runs to a whopping about 82 tons.
When it comes to the whole area of Nagoya City (about 326 km2), 326 km2 x 1 mm=(326 x 1000m x 1000m) x 0.001m=326,000 m2. The volume corresponds to nearly 1,100 times larger than the water volume of a school swimming pool. The unit of millimeter tends to give the impression of being negligible, but as mentioned above, even a rainfall of "only 1 mm" means a tremendous volume of water. Such a huge volume of rain water flows into the drain pipes and rivers. Not surprisingly, a rain storm that brings an intense rainfall such as tens of millimeters per hour causes floods.
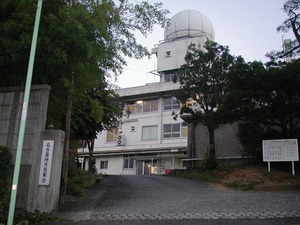
[Nagoya Local Meteorological Observatory]
Each prefecture of Japan has a local meteorological observatory (exceptionally, Hokkaido has seven and Okinawa four). The Nagoya Local Meteorological Observatory is located at Hiyori-cho, Chikusa-ku, that is, on the hill of the residential district (See Photo). When you visit the observatory, you will find it in a beautiful green environment with hill-specific comfortable breezes. Nagoya's weather information including temperature, humidity, wind direction and velocity, provided in the weather forecast or TV news is based on the observation here at this location. Sometimes, some people who live in the other parts of the Nagoya area may find the weather information sent from this observatory to be something different from real-life weather in their localities.
In the urban area, adjacent to the Nagoya City Science Museum, the streets are surfaced with asphalt or concrete with the most advanced drainage system installed, thus allowing rain water to flow down the drain pipes properly instead of staying here and there on the street surfaces. Besides, some old rivers and ponds have already been filled in or relocated underground. Moisture on the street surfaces would cool the air through evaporation even if the temperature rises to some unusually high level. But in reality the urban area no longer has enough moisture for evaporation. Furthermore, concrete, which is nowadays used as mainstream road construction material, strongly reflects solar light and heat. Under such circumstances, the temperature tend to become higher in the urban area than in the suburban area with more green vegetation. Particularly in summer, the urban area is noticeably hit hard by this environmental phenomenon.
This phenomenon is called "heat island" because a high-temperature area looks like a island whose temperature is higher than that of surrounding cooler sea. This "heat island" phenomenon is not limited to summer or daytime but it does occur in winter or at night as well, and it has proven to be more afflicting in winter or at night.
Article by Tetsuro Ojio, curator